Hacky and a bit off-topic…
This vignette shows how you can import bezier path data from an svg
file and then transform the format to the one needed by
ggforce::geom_bezier(). Unless you really want to import
bezier pathes from your svg file s, it might not be of huge interest.
What’s cool is that you can then draw pathes with svg software such as
inkscape. The resulting dataframe df_bezier_skeleton of
this vignette is also included in the package. If you’re not interested
in importing shapes from svg files you can just have a look how this
data can be used in vignette("create_benjamini_svg") very
result in a data frame of the svg file
library(ggbenjamini)
library(dplyr)
library(purrr)
library(tidyr)
library(ggplot2)
library(ggforce)
library(minisvg)
Load the skeleton from the svg file
There is an svg file included in the package that will serve as a skeleton of branches that we’ll grow the leaves on (This file was created with inkscape and then transformed with svgcairo to be in the needed format for the following code.). Let’s import it:
svg_skeleton <- system.file("extdata", "branch_skeleton.svg", package = "ggbenjamini")svg beziers to dataframe
Next we’ll load the svg object and extract the bezier curves into a
dataframe df_svg_skeleton:
svg_doc <- parse_svg_doc(svg_skeleton)

# you can descend in the elements of the object and find the part you're
# interested in. For this file we can extract our bezier pathes with:
pathes <- svg_doc$child$g[[1]]$child$path

path_strings <- map_chr(pathes, ~.x$attribs$d)


df_raw <- tibble(s = path_strings) %>%
  mutate(row = row_number()) %>%
  # separate the 2 parts of each curve
  separate_rows(s, sep = "(?=[mMcC] )") %>%
  filter(s != "") %>%
  separate(
    s,
    c("svg_point_type", "coords"),
    sep = " ",
    extra = "merge"
  ) %>%
  separate_rows(coords, sep = " ") %>%
  filter(coords != "") %>%
  mutate(coords = as.numeric(coords)) %>%
  mutate(i = ifelse(
    row_number() %% 2 == 1,
    "x",
    "y"
  )) %>%
  pivot_wider(
    values_from = coords,
    names_from = i,
    values_fn = list
  ) %>%
  unnest(c(x, y))

split_beziers <- function(df_bezier) {
  if (nrow(df_bezier) > 4) {
    n_others <- (nrow(df_bezier) - 4) / 3
    other_rows <- map(
      1:(n_others+1),
      ~ 1:4 + (.x - 1) * 3
    ) %>%
      unlist()
    res <- df_bezier[c(other_rows),] %>%
      mutate(i_curve = rep(1:(n_others+1), each = 4))
  }
  if (nrow(df_bezier) == 4) {
    res <- df_bezier
  }
  res
}

(df_svg_skeleton <- df_raw %>%
  group_by(row) %>%
  reframe(split_beziers(pick(dplyr::everything())))
)
#> # A tibble: 40 × 5
#>      row svg_point_type     x     y i_curve
#>    <int> <chr>          <dbl> <dbl>   <int>
#>  1     1 M               180.  230.       1
#>  2     1 C               158.  194.       1
#>  3     1 C               119.  221.       1
#>  4     1 C               120.  252.       1
#>  5     1 C               120.  252.       2
#>  6     1 C               119.  195.       2
#>  7     1 C               166.  165.       2
#>  8     1 C               185.  200.       2
#>  9     2 M               182.  163.       1
#> 10     2 C               160.  136.       1
#> # ℹ 30 more rows
Looking at the geom_bezier() plot,
df_svg_skeleton %>%
  # arrange(-row_number()) %>%
  ggplot(
    aes(
      x,
      y,
      group = interaction(row, i_curve),
      color = factor(row)
    )
  ) +
  ggforce::geom_bezier(arrow = grid::arrow()) +
  scale_y_reverse()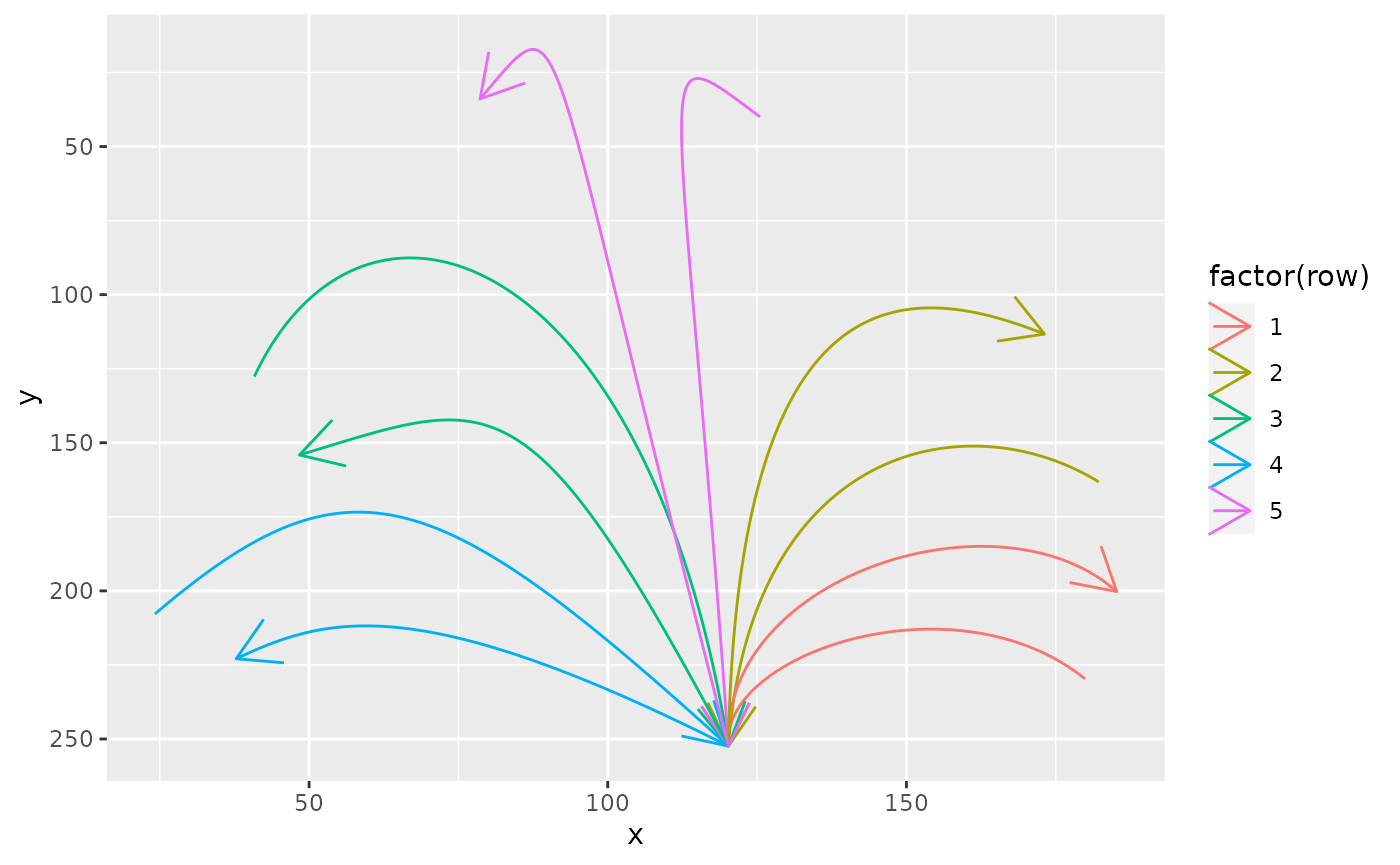
it’s as needed, but every second bezier is pointing in the wrong direction and the bezier group indices are not very important. Let’s correct this:
Cleaning up
df_bezier_skeleton <- df_svg_skeleton %>%
  group_by(row, i_curve) %>%
  # correct direction of beziers with index i_curve == 1:
  slice(ifelse(i_curve %% 2 == 1, 4:1, 1:4)) %>%
  # get rid of the pairing indices of this svg file and replace with
  # i_branch for each branch (only for clarity):
  mutate(i_branch = cur_group_id()) %>%
  ungroup() %>%
  select(-row, -i_curve) %>%
  relocate(i_branch)
Now this looks better.
df_bezier_skeleton %>%
  ggplot(
    aes(
      x,
      y,
      group = i_branch,
      color = factor(i_branch)
    )
  ) +
  ggforce::geom_bezier(arrow = grid::arrow()) +
  scale_y_reverse()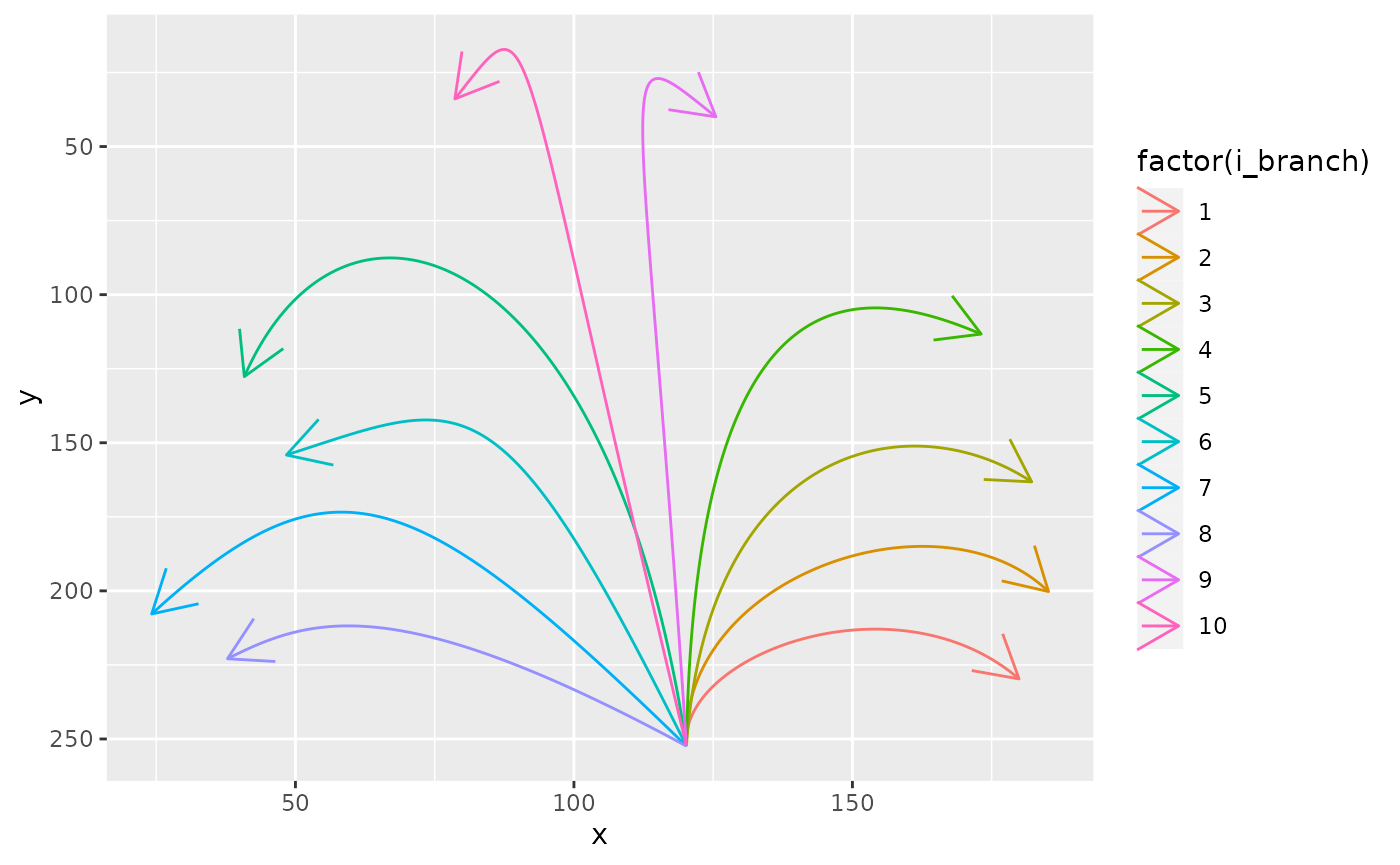
usethis::use_data()
We’ll store this dataframe in the package.
usethis::use_data(df_bezier_skeleton, overwrite = TRUE)
#> ✔ Setting active project to "/home/runner/work/ggbenjamini/ggbenjamini".
#> ✔ Saving "df_bezier_skeleton" to "data/df_bezier_skeleton.rda".
#> ☐ Document your data (see <https://r-pkgs.org/data.html>).