Create a tree with benjamini leaves
Source:vignettes/create_benjamini_tree.Rmd
create_benjamini_tree.RmdLet’s have a look how this package can be combined with the flametree package. First we’ll load some libraries.
library(ggbenjamini)
library(dplyr)
library(tidyr)
library(purrr)
# see here: https://github.com/djnavarro/flametree/
library(flametree)
library(ggplot2)
To start, we’ll first generate some flametrees and make some modifications:
ft <- flametree_grow(
    seg_wid = spark_decay(
      time = 0.3,
      multiplier = 3,
      constant = 0.1
    ),
    seed = 21,
    trees = 5,
    time = 2,
    angle = seq(-45, 45, 30),
    split = 2
  )

# modifications:
ft_mod <- ft
# shorten tree stems:
ft_mod[ft_mod$coord_y == 0, "coord_y"] <- c(0.8)
ft_mod[ft_mod$coord_y == 0.5, "coord_y"] <- c(0.9)
ft_mod <- ft_mod %>%
  # increase total size of trees:
  mutate_at(c("coord_x", "coord_y"), ~ . * 200) %>%
  # the following will yield a smooth change of the thickness & color:
  group_by(coord_x, coord_y) %>%
  mutate(n = n()) %>%
  mutate(
    seg_wid = ifelse(n > 1, min(seg_wid), seg_wid),
    seg_col = ifelse(n > 1, max(seg_col), seg_col)
    ) %>%
  ungroup() %>%
  select(-n)

p <- flametree_plot(
  ft_mod,
  background = "white",
  palette = c("brown", "forestgreen"))
p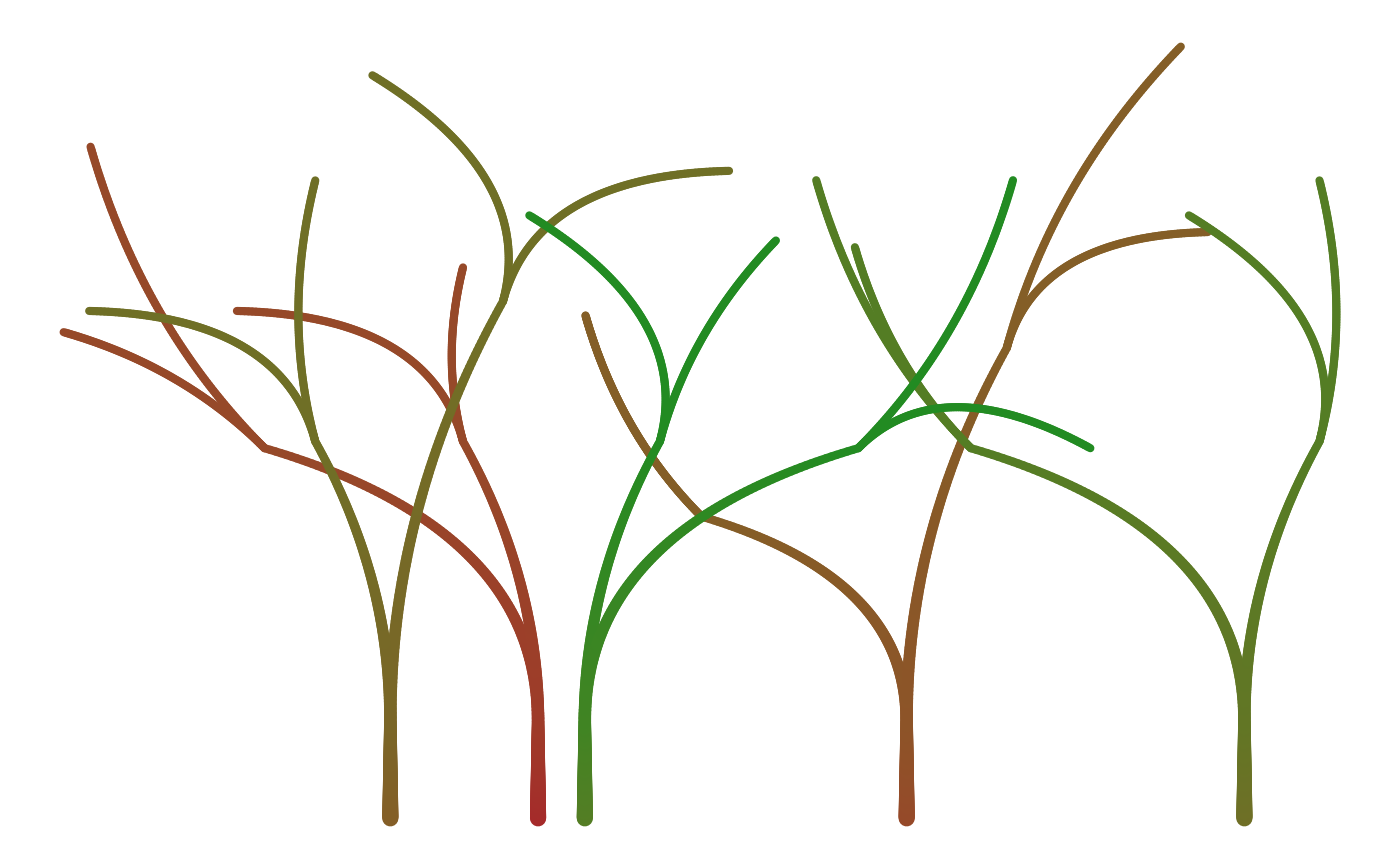
flametree uses quadratic beziers (made with 3 points).
benjamini_branch() needs four points for each bezier.
Therefore we duplicate the control point in the middle:
df_leaves <- ft_mod %>%
  # Only apply to the top layer:
  filter(id_time == max(id_time)) %>%
  group_by(id_pathtree) %>%
  reframe(tibble(
    x = coord_x[c(1, 2, 2, 3)],
    y = coord_y[c(1, 2, 2, 3)]
  )) %>%
  group_by(id_pathtree) %>%
  group_split() %>%
  map_dfr(benjamini_branch, .id = "i_branch") %>%
  unite(id, i_branch, i_leaf, element, i_part, remove = FALSE)
We’ll remove the top layer of branches from the flametrees and recreate the plot from above.
p <- flametree_plot(
  ft_mod %>%
    # remove the upper layer:
    filter(id_time != max(id_time)),
  background = "white"
)
Now we can replace it with branches with leaves by just adding another layer to the ggplot2 object.
p +
  ggforce::geom_bezier(
    data = df_leaves %>% drop_na(x),
    aes(x = x, y = y, group = id),
    inherit.aes = FALSE,
    alpha = 0.5,
    color = "forestgreen"
  )