This vignette shows how {rtweettree} can be used to generate network graphs visualizing the reactions on a tweet (replies, quotes and favorites) as a tree. The nodes correspond to tweets and the users who interact with them with these reactions.
Scraping
rtweettree tries to scrape as much as information as possible that might be related to the tweet at the root of the tree. Please beware that the twitter API doesn’t allow to scrape all sub tweets. And that for large amounts of interactions to a tweet it can take a long time due to rate limits (please refer to the twitter developer website on rate limits, or the documentation of the rtweet functions).
Scrape tweets
Tweets on twitter are uniquely classified via the status id:
# Replace this number by any status_id (the last number in the twitter.com url of a tweet):
main_status_id <- "1438481824922181635"
Now let’s scrape:
rtweettree_data_scraped <- rtweettree_data(main_status_id)To allow to test the package in offline use (and without setting up an account for the twitter api), you can also load this dataset which is already included in the package:
rtweettree_data_scraped <- rtweettree_data_exampleCreate tbl_graph object
The relevant twitter information of these tweets is translated into a tidygraph network object:
g <- rtweettree_tbl_graph(rtweettree_data_scraped)
g
#> # A tbl_graph: 9 nodes and 18 edges
#> #
#> # A directed acyclic simple graph with 1 component
#> #
#> # Node Data: 9 × 6 (active)
#>   name                type  screen_name data              text       profile_pic
#>   <chr>               <chr> <chr>       <list>            <chr>      <list>
#> 1 1438476950746636291 user  rtweetbird1 <tibble [1 × 18]> <NA>       <magck-mg>
#> 2 1438480252003569671 user  rtweetbird3 <tibble [1 × 18]> <NA>       <magck-mg>
#> 3 1438479415550390275 user  rtweetbird2 <tibble [1 × 18]> <NA>       <magck-mg>
#> 4 1438481824922181635 tweet rtweetbird1 <tibble [1 × 90]> this is a… <magck-mg>
#> 5 1438483457697591297 tweet rtweetbird3 <tibble [1 × 90]> @rtweetbi… <magck-mg>
#> 6 1438482432030818307 tweet rtweetbird2 <tibble [1 × 90]> @rtweetbi… <magck-mg>
#> # … with 3 more rows
#> #
#> # Edge Data: 18 × 5
#>    from    to user_id             screen_name type
#>   <int> <int> <chr>               <chr>       <chr>
#> 1     4     5 1438480252003569671 rtweetbird3 reply
#> 2     4     6 1438479415550390275 rtweetbird2 reply
#> 3     4     7 1438479415550390275 rtweetbird2 reply
#> # … with 15 more rows
Now we can make use of the full power of tidygraph, e.g., add a column to the nodes tibble, showing how far the respective node is from the main tweet in the graph:
g <- g %>%
  # calculate the distance to the tree root with tidygraph:
  mutate(dist_to_root = node_distance_from(node_is_source()))
g %>% as_tibble()
#> # A tibble: 9 × 7
#>   name                type  screen_name data   text     profile_pic dist_to_root
#>   <chr>               <chr> <chr>       <list> <chr>    <list>             <dbl>
#> 1 1438476950746636291 user  rtweetbird1 <tibb… <NA>     <magck-mg>             1
#> 2 1438480252003569671 user  rtweetbird3 <tibb… <NA>     <magck-mg>             2
#> 3 1438479415550390275 user  rtweetbird2 <tibb… <NA>     <magck-mg>             1
#> 4 1438481824922181635 tweet rtweetbird1 <tibb… this is… <magck-mg>             0
#> 5 1438483457697591297 tweet rtweetbird3 <tibb… @rtweet… <magck-mg>             1
#> 6 1438482432030818307 tweet rtweetbird2 <tibb… @rtweet… <magck-mg>             1
#> 7 1438482309490040835 tweet rtweetbird2 <tibb… @rtweet… <magck-mg>             1
#> 8 1438484289616859145 tweet rtweetbird3 <tibb… this is… <magck-mg>             1
#> 9 1438483563314360322 tweet rtweetbird3 <tibb… @rtweet… <magck-mg>             2
Visualize graphs
Please make sure not to publish information from Twitter you are not allowed to and to comply in strict accordance with the twitter developer terms! The example rtweet data in this article only contains the tweets of three dummy accounts I created. But probably you’re not allowed to publish all this information for the main_status_id of any other tweet.
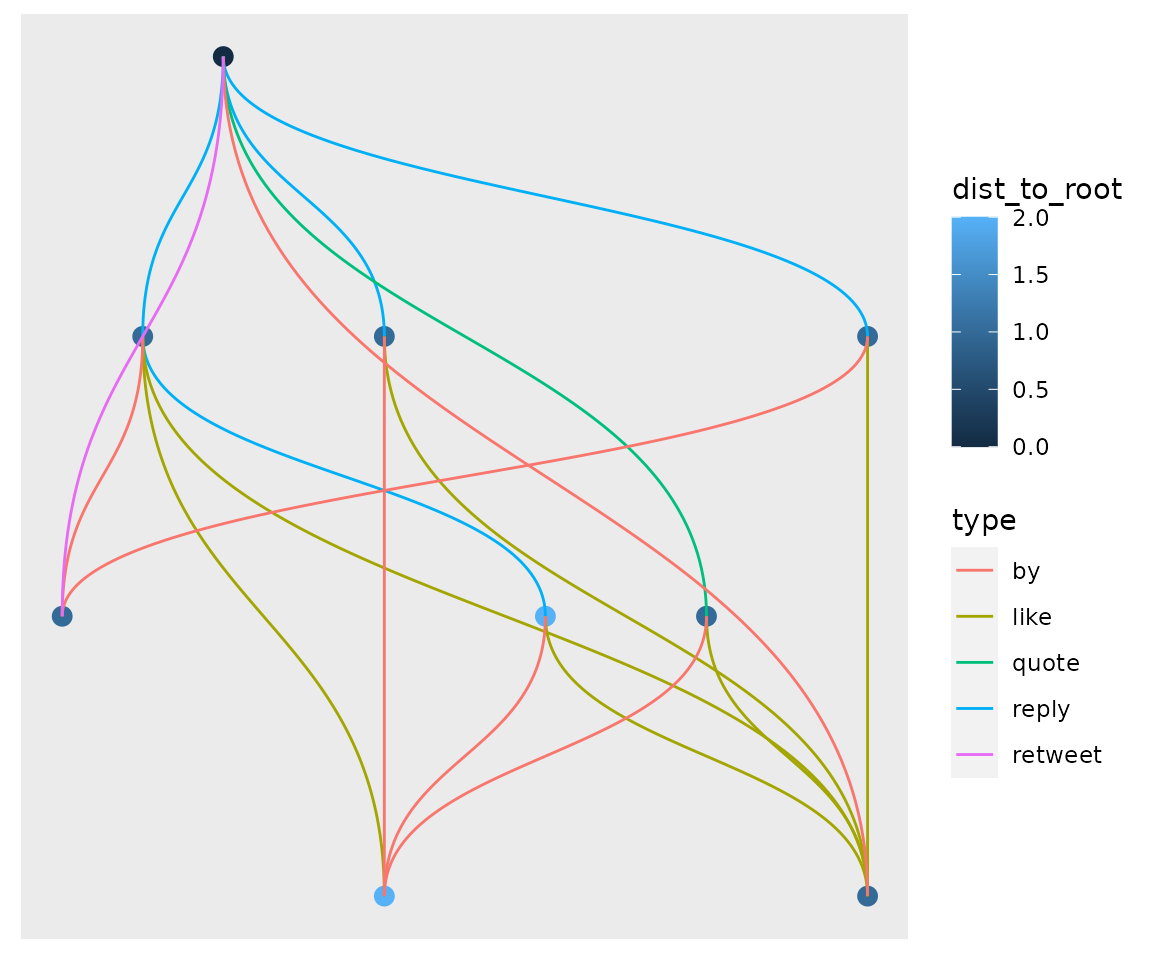
The generated graph object consists of nodes representing tweets and users. These are connected by edges that can be
- replies & quotes (connecting tweets),
- “by” connecting the author to his respective tweet, and
- “like”/“retweet” connecting the user to the tweet he liked/retweeted.
Hierarchical tree plot with ggraph
We can generate a simple tree graph of the various tweets and users with:
g %>%
  ggraph() +
  geom_node_point(aes(color = dist_to_root), size = 3) +
  geom_edge_diagonal(aes(color = type))
#> Using `sugiyama` as default layout
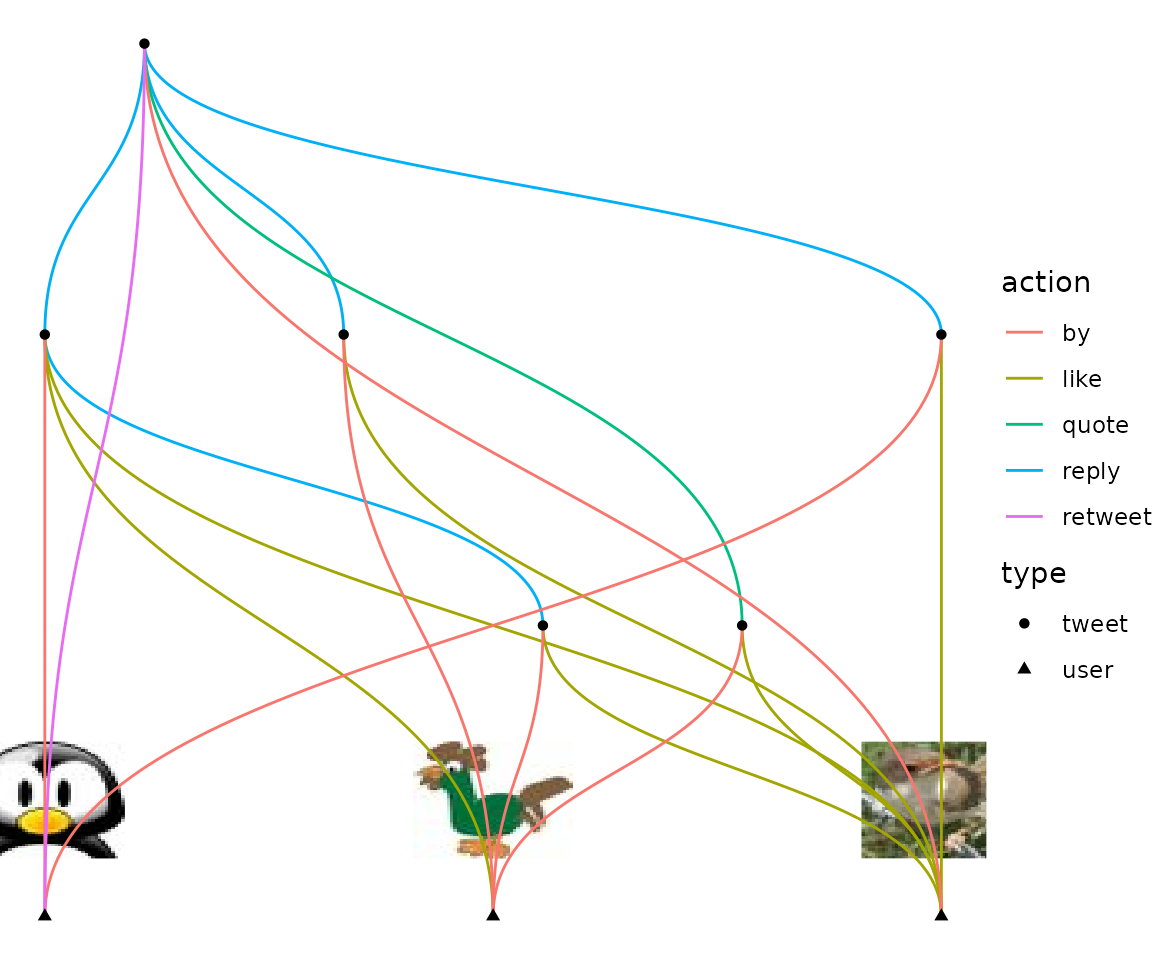
This yields something similar to the autoplot() method of the package:
# (In order to include the profile pictures in the graph you need an internet
# connection)
ggplot2::autoplot(g, add_profile_pics = TRUE)
#> Using `sugiyama` as default layout
Using ggiraph
With ggiraph we can generate an interactive tree graph. Let’s first add information to the nodes dataframe:
g <- g %>%
  # Add on click information to the graph nodes:
  # (twitter will correct the "fake_screen_name" if the tweet is still online):
  mutate(url = case_when(
      type == "user" ~ glue::glue("https://twitter.com/{screen_name}/"),
      type == "tweet" ~ glue::glue("https://twitter.com/fake_screen_name/status/{text}")
  )) %>%
  mutate(onclick = glue::glue('window.open("{url}")')) %>%
  # add tooltip information to the nodes:
  mutate(tooltip = case_when(
      type == "user" ~ screen_name,
      type == "tweet" ~ paste0(screen_name, ":\n", stringr::str_wrap(text, 30))
  ))
Now we can use this information with geom_point_interactive():
g2 <- ggraph(g) +
  geom_edge_diagonal(aes(color= type)) +
  geom_point_interactive(
    aes(
      x = x,
      y = y,
      color = type,
      data_id = screen_name, # this highlights all tweets of one user
      tooltip = tooltip,     # add the tooltip
      onclick = onclick      # opens the url created above when clicking on the nodes
    ),
    size = 3
  ) +
  ggtitle(
    "Hover over the nodes to see\nthe tweets/user names.",
    subtitle = "Click on the nodes to open\nthe tweets/users on twitter.com"
  )
#> Using `sugiyama` as default layout
p <- girafe(code = print(g2), width_svg = 4, height_svg = 4)

p <- girafe_options(
  x = p,
  opts_zoom(min = 0.3, max = 5),
  opts_sizing(width = 0.7),
  opts_hover(
    girafe_css(
      css = "stroke:yellow;",
      point = "stroke-width:6px")
    )
  )
p