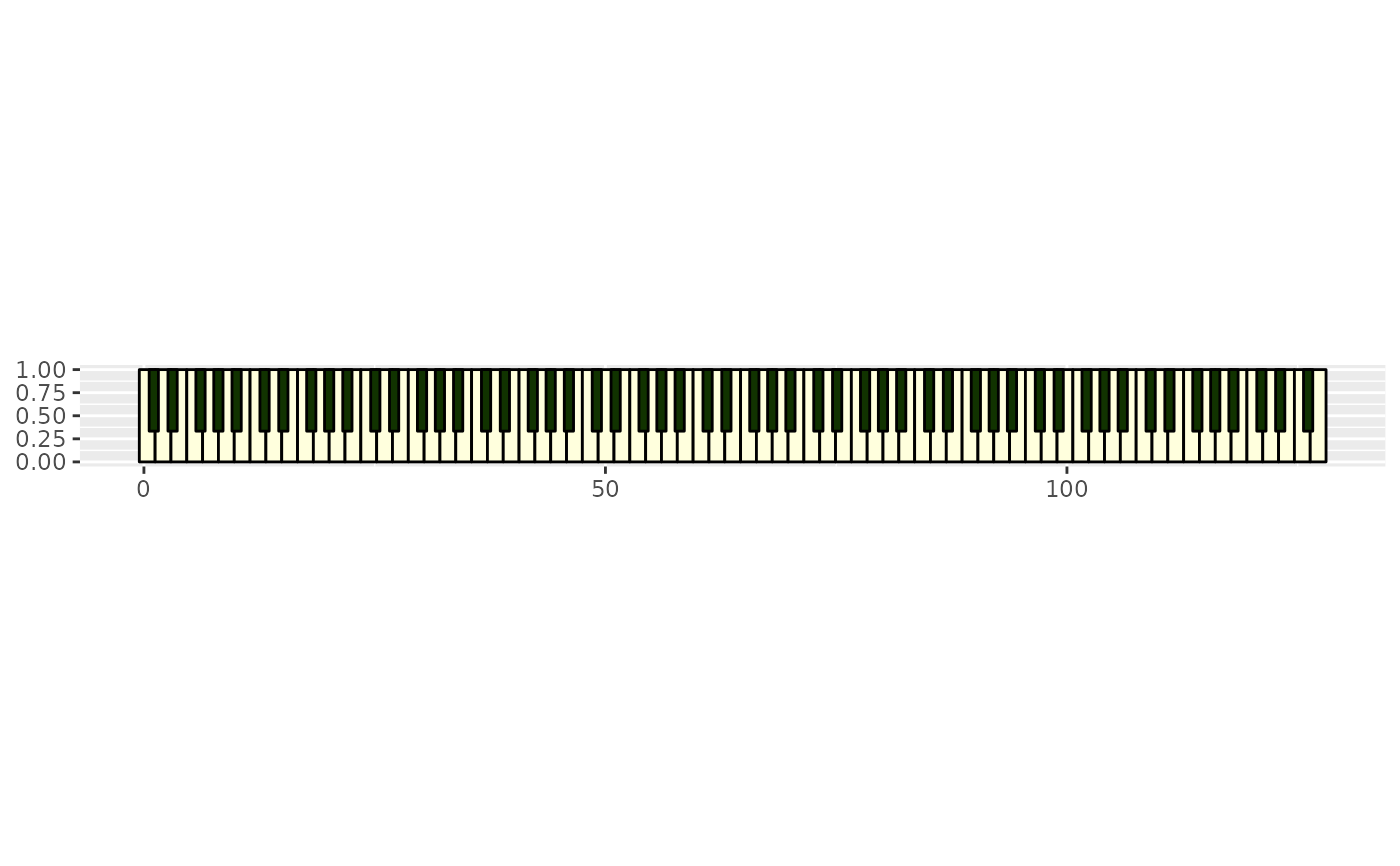
A table containing the piano keys coordinates. Each piano key is centered at the midi note value it represents.
Format
A data frame with 127 rows and 6 variables:
- midi
integer from 0 - 127 containing the midi pitches
- layer
integer 1 or 2 depending on whether key is white (1) or black (2)
- xmin
xmin coordinate of the key
- ymin
ymin coordinate of the key
- xmax
xmax coordinate of the key
- ymax
ymax coordinate of the key
Examples
library(ggplot2)
# Print dataframe:
piano_keys_coordinates
#> # A tibble: 128 × 6
#>     midi layer   xmin  ymin  xmax  ymax
#>    <int> <dbl>  <dbl> <dbl> <dbl> <dbl>
#>  1     0     1 -0.5   0      1.21     1
#>  2     1     2  0.568 0.333  1.57     1
#>  3     2     1  1.21  0      2.93     1
#>  4     3     2  2.61  0.333  3.61     1
#>  5     4     1  2.93  0      4.64     1
#>  6     5     1  4.64  0      6.36     1
#>  7     6     2  5.63  0.333  6.63     1
#>  8     7     1  6.36  0      8.07     1
#>  9     8     2  7.57  0.333  8.57     1
#> 10     9     1  8.07  0      9.79     1
#> # ℹ 118 more rows
# Plot the keyboard:
piano_keys_coordinates %>%
  # plot white keys first that they don't cover half of the black keys:
  dplyr::arrange(layer) %>%
  ggplot(aes(ymin = ymin, ymax = ymax, xmin = xmin, xmax = xmax, fill = factor(layer))) +
  geom_rect(color = "black", show.legend = FALSE) +
  scale_fill_manual(values = c("#ffffdd", "#113300")) +
  coord_fixed(ratio = 10)